🎉 Celebrating 25 Years of GameDev.net! 🎉

Not many can claim 25 years on the Internet! Join us in celebrating this milestone. Learn more about our history, and thank you for being a part of our community!

NSight captured RTVs are black

Started by
9 comments, last by turanszkij 6 years, 4 months ago

I wanted to give NVidia Nsight 5.5 a try in Visual Studio 2017 15.5.

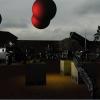
My program launches, runs and looks correctly, but when I capture a frame, my window becomes black (except for the ImGUI rendering). My 3D and 2D content are gone.

A new popup window, NVidia Nsight replay, shows a timeline with the draw events. Here, I can see all ImGUI draw calls and their regions of influence. But again, I do not see my 3D and 2D content. Only a marker on the timeline specifies the execution of the draw call. Except for the ImGUI regions of influence, I see the region of influence of a fullscreen triangle (used for transferring my intermediate RTV to the back buffer RTV).

In the API inspector, I notice a similar story, my RTVs are sort of black with some white border?

Clipboard01.thumb.jpg.a3dbf6fb2d1940c8e10a88c37eeab1c5.jpg

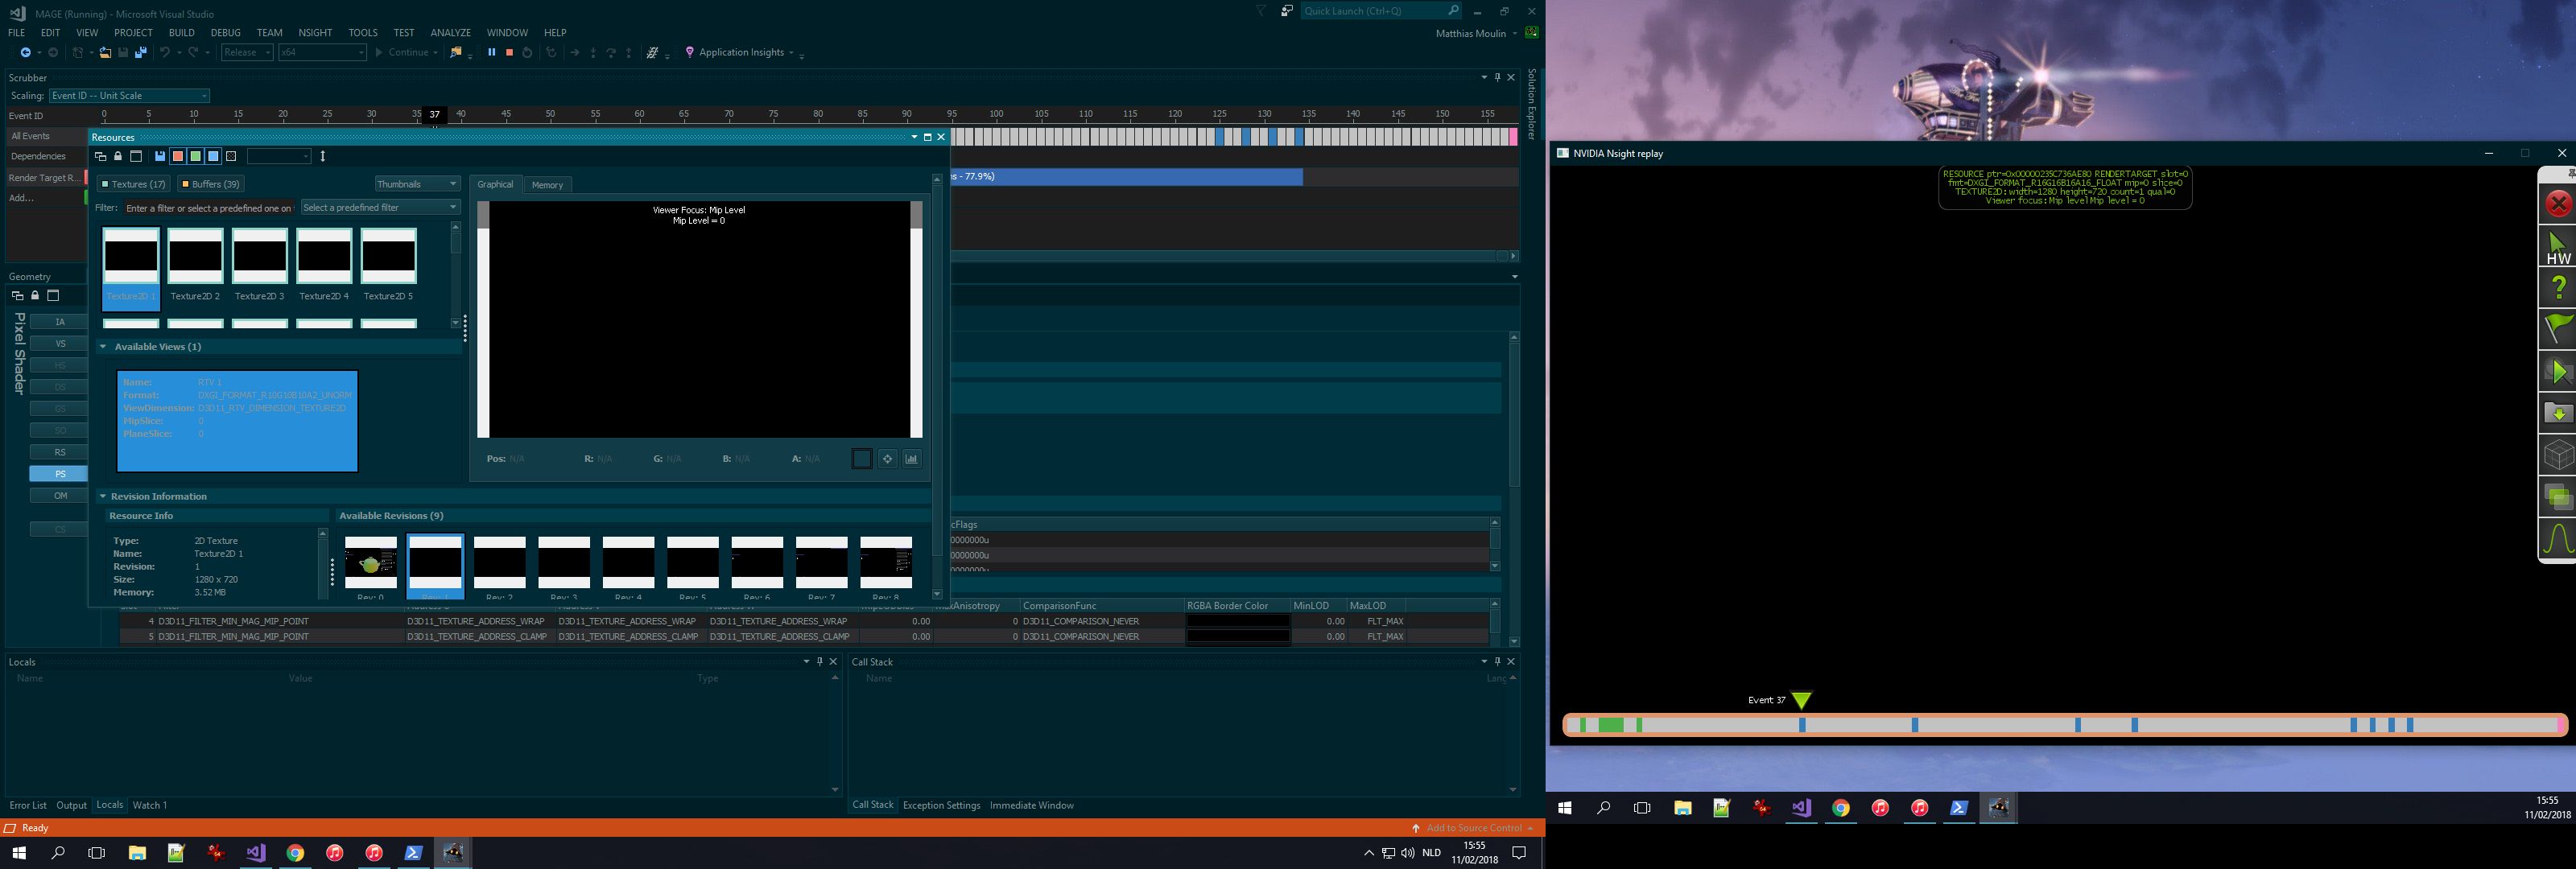
P.S.: you can see the whole previous frame (teapot). This is revision 0 (before cleaning the RTV).

🧙

Advertisement

Problem solved (as well) thanks to @baldurk (https://github.com/baldurk/renderdoc/issues/869#issuecomment-364961247)

🧙

Hm, I also had a question some time ago asking if we should always unmap the buffers in DX11, so these are the kinds of undefined behaviour I could have expected there as well, nasty!

Btw I have a problem with Nsight as it can't show anything in the geometry window for my engine. The 3D viewer doesn't show anything and the interpret data view is also messed up, but it only occurs fo my engine, other game captures worked fine. How about yours, does it work for you? :) (I reported it to the Nsight devsupport team a long time ago but they couldn't solve it unfortunately)

48 minutes ago, turanszkij said:

Hm, I also had a question some time ago asking if we should always unmap the buffers in DX11, so these are the kinds of undefined behaviour I could have expected there as well, nasty!

Btw I have a problem with Nsight as it can't show anything in the geometry window for my engine. The 3D viewer doesn't show anything and the interpret data view is also messed up, but it only occurs fo my engine, other game captures worked fine. How about yours, does it work for you? :) (I reported it to the Nsight devsupport team a long time ago but they couldn't solve it unfortunately)

I think I removed the variable name back then to be "clever". I didn't want to add a maybe_unused attribute. Though, I tried in Clang as well and to my surprise it isn't considered as an unused variable.

I will check MAGE and WickedEngine tomorrow. Found out about the mesh viewer in the docs, otherwise wouldn't have found it during my first tries. (It is actually due to RenderDoc's features, that I start to look for similar features in Night :) )

🧙

19 hours ago, turanszkij said:

Btw I have a problem with Nsight as it can't show anything in the geometry window for my engine. The 3D viewer doesn't show anything and the interpret data view is also messed up, but it only occurs fo my engine, other game captures worked fine. How about yours, does it work for you?

MAGE

My 3D and 2D content do not show either in the Graphical window. The vertex buffer seems to be corrupt looking at the strange and very high values. For a 3D model, I even see "Floating Point Specials Detected In Vertex Data!" due to lots of nans. But as always my ImGui content is shown in the Graphical window and the vertex buffers seem ok.

WickedEngine

The same story. None of the 3D or 2D content shows up in the Graphical window. The vertex buffers seem to be corrupt containing very high and nan values.

Still I have the idea with both do something wrong as ImGui's geometry shows up correctly and its vertex buffers seem ok.

🧙

10 minutes ago, matt77hias said:

MAGE

My 3D and 2D content do not show either in the Graphical window. The vertex buffer seems to be corrupt looking at the strange and very high values. For a 3D model, I even see "Floating Point Specials Detected In Vertex Data!" due to lots of nans. But as always my ImGui content is shown in the Graphical window and the vertex buffers seem ok.

WickedEngine

WIP

Thanks, you don't have to check my engine lol I already checked on a bunch of PCs for the same result. :)

So you have the same issue. The strange thing is that the data can be viewed correctly in the resource view, but in a raw format without reinterpreting according to the input layout. I am sort of OK with that, but makes things a bit more difficult. I recall it broke somewhere around the time I rewrote my vertex buffers to be deinterleaved positions, texcoords, etc. Do your vertex buffers have all the properties interleaved or not eg. SOA or AOS layout?

1 hour ago, turanszkij said:

Thanks, you don't have to check my engine lol I already checked on a bunch of PCs for the same result. :)

Added anyway (but needed to install some additional VS features + a full build takes a while on my notebook, so it took a while to see the results).


1 hour ago, turanszkij said:

Do your vertex buffers have all the properties interleaved or not eg. SOA or AOS layout?

For all vertex buffer: AoS layout.

🧙

23 minutes ago, matt77hias said:

Added anyway (but needed to install some additional VS features + a full build takes a while on my notebook).


For all vertex buffer: AoS layout.

Never mind I just checked the simplest geometry in the font rendering, which is AoS as well, still nothing. Nsight devsupport said they are working on it, but that was like a year ago already..

Just use the platform-independent RenderDoc :P (meshes are shown and vertex buffers are ok)

🧙

But Nsight has a profiler too. I use it quite often. There is a nice blog how to use it: https://devblogs.nvidia.com/the-peak-performance-analysis-method-for-optimizing-any-gpu-workload/

This topic is closed to new replies.

Advertisement